|
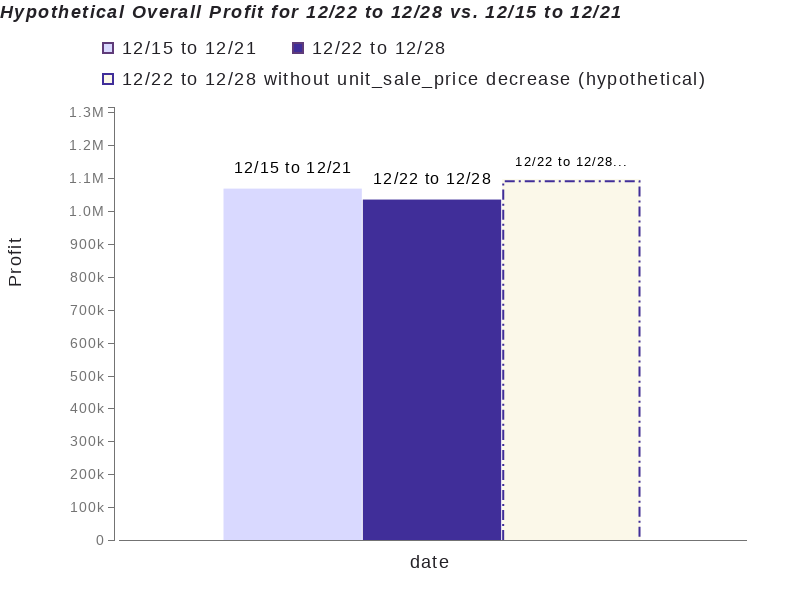
| Week over Week: $1.0M for 12/22 to 12/28 vs. $1.1M for 12/15 to 12/21 | | Profit: -3.1% to $1.0M |
|
 |
Profit's decrease vs. last week is a loss of $33K |  |
unit_sale_price fully explains profit's decrease |  | Without the negative impact of this driver, profit would have been up +2.7% instead of down -3.1% |
|
|
| Profit is
-$33K
because: | Percent
Change |  |
| Independent
Impact |  |
| Incremental
Impact |  |
| | -3.9% | -$62K | -$62K |
| Explains
-$62K
| | Fully explains the $33K decrease |
|
|
|
| Between unit_sale_price and unit_cost, unit_sale_price had a greater impact on profit. | | Profit |  -3.1%
-3.1% |
| |
| Sale Price |
 -3.9%
-3.9% | | |
| Cost |
 -5.3%
-5.3% | |
|
|
|
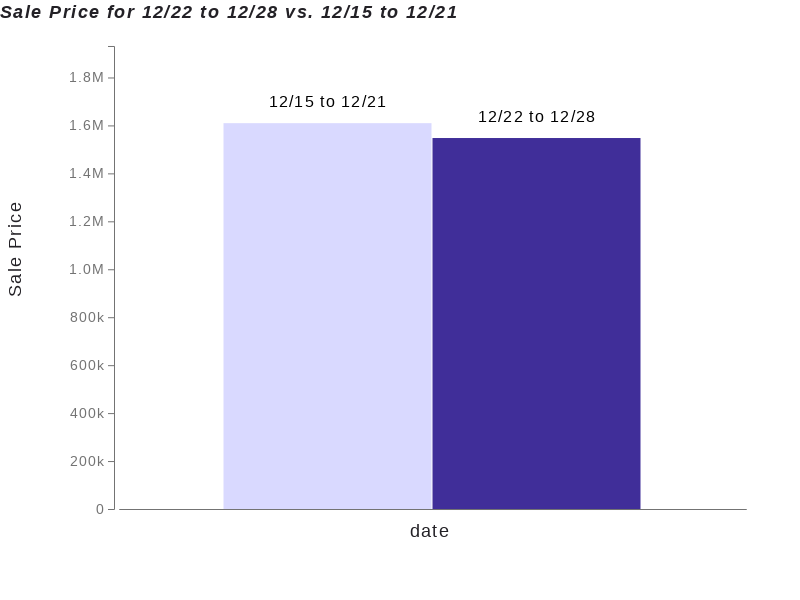
| 1. Metric › unit_sale_price -3.9% | | unit_sale_price is down -3.9% between 12/22 to 12/28 ($1.5M) and 12/15 to 12/21 ($1.6M), resulting in a decrease of -$62K. |
| | unit_sale_price is
down
-$62K
because: | Percent
Change |  |
| Independent
Impact |  |
| Incremental
Impact |  |
| 
| | product_category | |
Board Game |
|
| -11.3% | -$62K | -$62K |
| -14.1% | -$16K | -$19K |
 | | campaign | |
announcement_blast |
|
| -25.3% | -$41K | -$14K |
| Explains
-$96K
| | Fully explains the $62K decrease |
|
|  | | Without unit_sale_price's -3.9% decrease, overall profit for 12/22 to 12/28 would have been up +2.7% instead of down -3.1%. |  |
| |
|
|
| What else is driving profit? |
|
|
|
| Column | Driver | Abs. Change | Pct. Change | Overall Impact | | Metric | unit_sale_price |  $62K $62K |  3.9% 3.9% |  5.8% 5.8% | | product_category | Board Game |  $40K $40K |  10.9% 10.9% |  3.8% 3.8% | | Metric | unit_cost |  $29K $29K |  5.3% 5.3% |  2.7% 2.7% | | campaign | announcement_blast |  $28K $28K |  25.4% 25.4% |  2.6% 2.6% | | product_name | Operation |  $18K $18K |  38.4% 38.4% |  1.7% 1.7% | | product_name | Dungeons & Dragons |  $16K $16K |  33.3% 33.3% |  1.5% 1.5% | | source | Organic Search |  $15K $15K |  5.7% 5.7% |  1.4% 1.4% | | campaign | outbrain |  $15K $15K |  19.6% 19.6% |  1.4% 1.4% | | campaign | linkedin |  $11K $11K |  14.3% 14.3% |  1% 1% | | product_name | Connect Four |  $10K $10K |  26% 26% |  1% 1% | | source | Email Marketing |  $9,551 $9,551 |  3.4% 3.4% |  0.9% 0.9% | | source | Social Media |  $8,166 $8,166 |  3.1% 3.1% |  0.8% 0.8% |
|
|
| Column | Driver | Abs. Change | Pct. Change | Overall Impact | | campaign | weekly_newsletter |  $12K $12K |  13.3% 13.3% |  1.1% 1.1% | | product_name | Pong |  $11K $11K |  45% 45% |  1.1% 1.1% | | product_name | Mouse Trap |  $11K $11K |  35.8% 35.8% |  1% 1% | | product_name | Risk |  $10K $10K |  30.1% 30.1% |  1% 1% | | campaign | facebook |  $10K $10K |  16.2% 16.2% |  1% 1% | | product_name | Pretty Pretty Princess |  $10K $10K |  32.2% 32.2% |  0.9% 0.9% | | campaign | google ads |  $8,893 $8,893 |  13.5% 13.5% |  0.8% 0.8% | | product_name | Atari 2600 |  $8,825 $8,825 |  31.1% 31.1% |  0.8% 0.8% | | product_category | Electronic Game |  $7,304 $7,304 |  2.1% 2.1% |  0.7% 0.7% | | product_name | Twister |  $6,939 $6,939 |  24.7% 24.7% |  0.6% 0.6% | | product_name | Scrabble |  $6,508 $6,508 |  20.5% 20.5% |  0.6% 0.6% | | campaign | industry_news_in_context |  $6,265 $6,265 |  7.7% 7.7% |  0.6% 0.6% |
|
|
| This analysis compares total profit between 12/22 to 12/28 and 12/15 to 12/21. | | The following dimensions are included in analysis of potential drivers of profit: |  |
product_name (e.g. "Atari 2600") |  |
product_category (e.g. "Board Game") |  |
source (e.g. "Email Marketing") |  | campaign (e.g. "announcement_blast") |
|
| The data was retrieved using a SQL query on Mon. December 29, 2025 at 3:35am EST. | |